Mastering the Markets
By Edward Gonzalez
The framework in which traders study price movements through data is known as Technical Analysis. In theory,you can look at historical price movements and determine the current trading conditions and potential price movement of an asset. The main evidence for using technical analysis is, theoretically, all current market information is reflected in price. Since price reflects all the information that is out there, then price action is all you really need to make a trade. With crypto, some news spreads like wildfire and can affect the price action of different cryptocurrencies. Traders mostly depend on chart patterns and trends to predict price action movements.
Technical analysis is all about studying price action history and looking for certain repeatable patterns. If a price level was held as a key support or resistance zone in the past, traders will keep an eye out for it and base their trades around that historical price level. Technical analysts look for similar patterns that have formed in the past and form trade ideas and systems with the belief that the price will act the same way it did before.
Traders use candlestick charts because they are the easiest way to visualize historical data. If you take a look at a candlestick, you will see a figure in the shape of a rectangular box. This is what is known as the body, which is the widest part of the candlestick. This is the first thing to observe when analyzing a chart. The body of a candlestick demonstrates the open and the close of the specific period. This implies, for example, that in a 1-hour chart every candlestick body will demonstrate the opening and closing price for that one-hour period.
In addition, the thin lines above and below the body are called “wicks” or “shadows.” The wicks at the bottom and at the top of the candlestick present the lowest and the highest prices reached during that candlestick’s period of time. Furthermore, the color of the body tells you whether the candlestick is bullish (meaning that it rises) or bearish (meaning that it falls). If the body is green, then the currency pair closed higher than it opened. If the body is red, it means the currency pair closed lower than it opened.
- Open Price: the open price depicts the first traded price during the formation of the new candle.
- High Price: the top of the upper wick. If there is no upper wick, then the high price is the open price of a bearish candle or the closing price of a bullish candle.
- Low Price: the bottom of the lower wick. If there is no lower wick, then the low price is the open price of a bullish candle or the closing price of a bearish candle.
- Close Price: the close price is the last price traded during the formation of the candle.
- Zones are an area, not a price point
- Zones are spots on the chart where price reverses repeatedly
- Zones may be extreme highs or lows on the chart
- Zones are where traders find trading opportunities
- The more a price has rebounded from a zone the more valid it is
- Support and resistance zones rarely need to be modified
- Line charts can help traders find zones
- Zones are often seen by many traders
📰 More News
More News
News
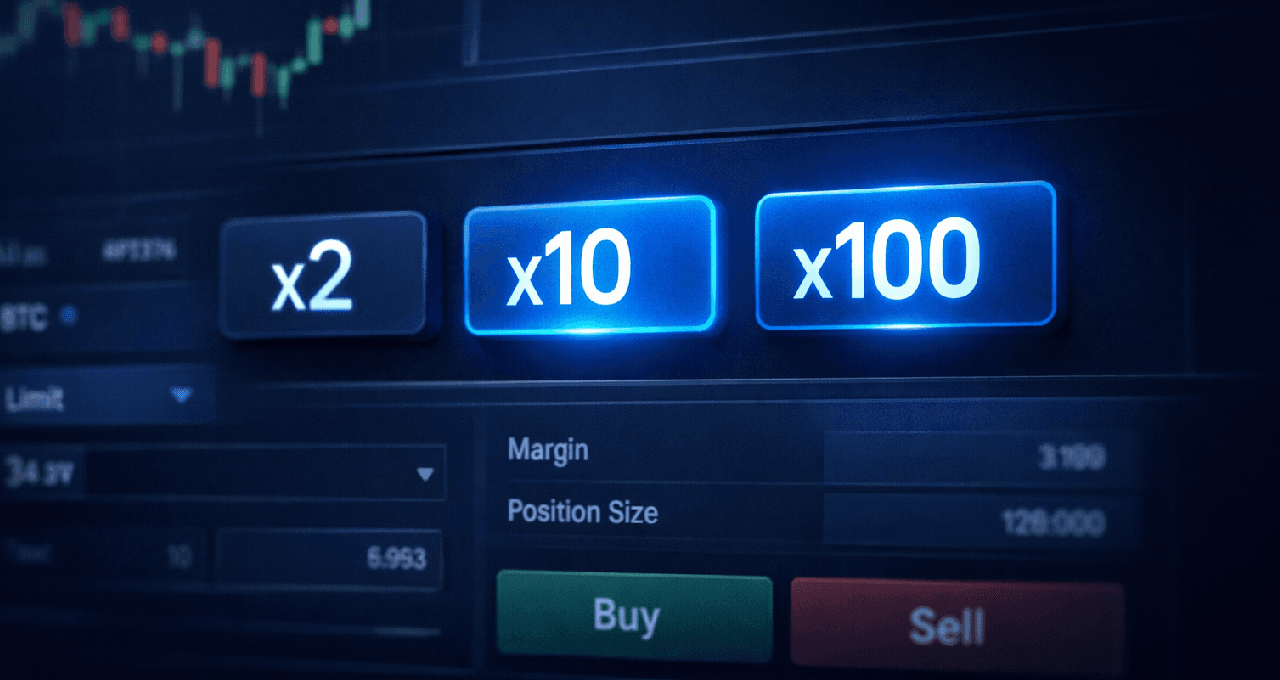
The Illusion of Control in Crypto Futures Trading
Discover the illusion of control in crypto futures trading. Explore why demo accounts matter, compare BTCC, Bybit, and Coinbase platforms, and learn risk management for smarter leveraged trading.
Read more

News
Bitcoin at a Crossroads: Is the Digital Gold Dream Dead or Just Getting Started
Bitcoin faces uncertainty in 2026 crypto winter: Is digital gold dead or poised for revival? Explore bear and bull cases, regulation, and trading strategies amid price halving and institutional challenges.
Read more
News
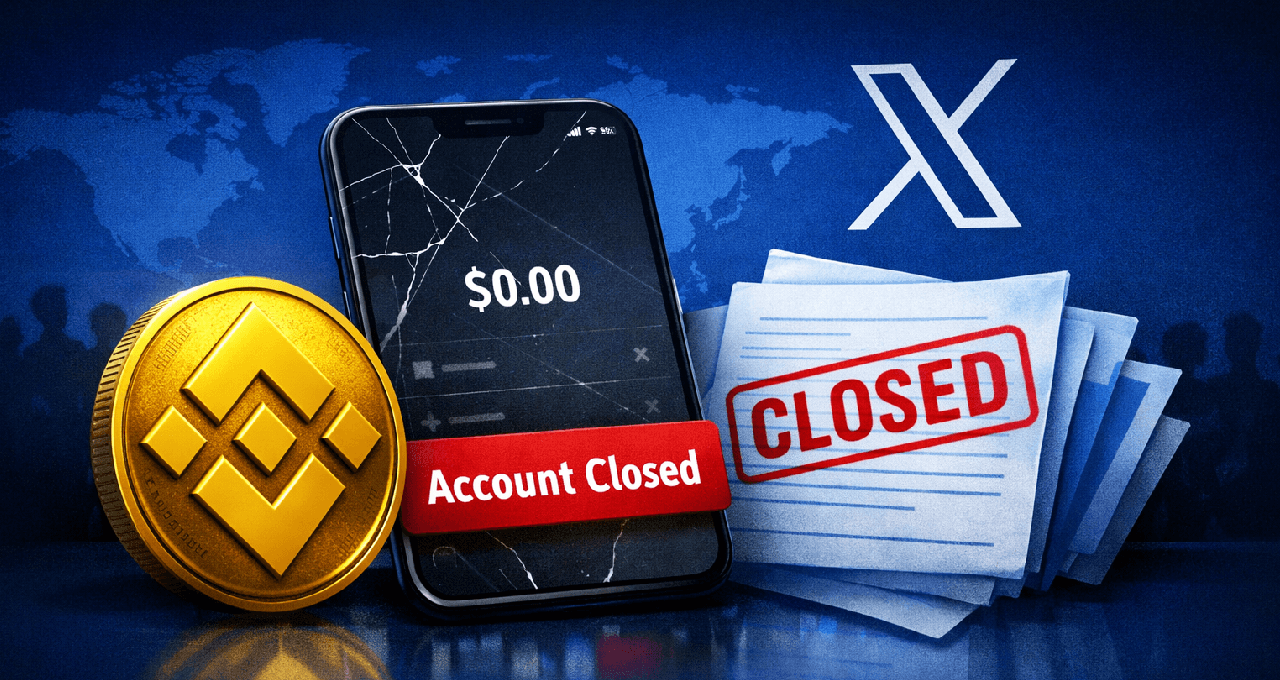
The Great Exodus: Why Thousands Are Closing Their Binance Accounts
Thousands close Binance accounts amid #BinanceExodus fears of insolvency and FTX repeat. On-chain data shows stable reserves—no mass outflows. Diversify now to protect your crypto assets.
Read more